


Search data in stock analysis: brand searches improve the forecast, generic searches don’t
If you build models to value listed e-commerce companies, you’re probably missing a data source that’s freely available and updated every month: what people search for on Google. I gave a talk at Redeye on exactly that. Together with analyst Jacob, we tested two hypotheses against actual revenue growth at eight listed fashion retailers: Nelly Group, RevolutionRace, Zalando, Boozt, Bubbleroom, Björn Borg, H&M and Ellos. One hypothesis held up. The other didn’t. Here’s the fun part: the analysis itself doesn’t require you to be a search engine optimization expert. The data sits in tools like Ahrefs. Download it and let an AI tool such as Claude look for patterns. Anyone with access to the data can run this themselves.
What you’ll learn from watching the video
- Why brand searches are an early signal of how the quarter is shaping up, and why that signal arrives before the results
- Why generic searches like “hiking trousers” can’t be linked to quarterly results, even though the traffic is valuable
- Which types of company the signal works best for, and which it doesn’t
- How the four channels that drive sales for a pure-play e-commerce business fit together: brand, SEO, Google Ads and AI search
Watch the talk
Brand searches: the signal that actually works
A brand search is when someone types “Revolution Race” or “nelly” into Google. This isn’t someone looking for inspiration. She already knows where she’s headed, and she’s using Google as a shortcut to the checkout.
We compared year-on-year growth in brand search volume with year-on-year revenue growth, for each company and across four different time windows before the end of the quarter. The correlation is clear for several of the companies, and strongest for those that are a single brand with a strong focus on their home market.
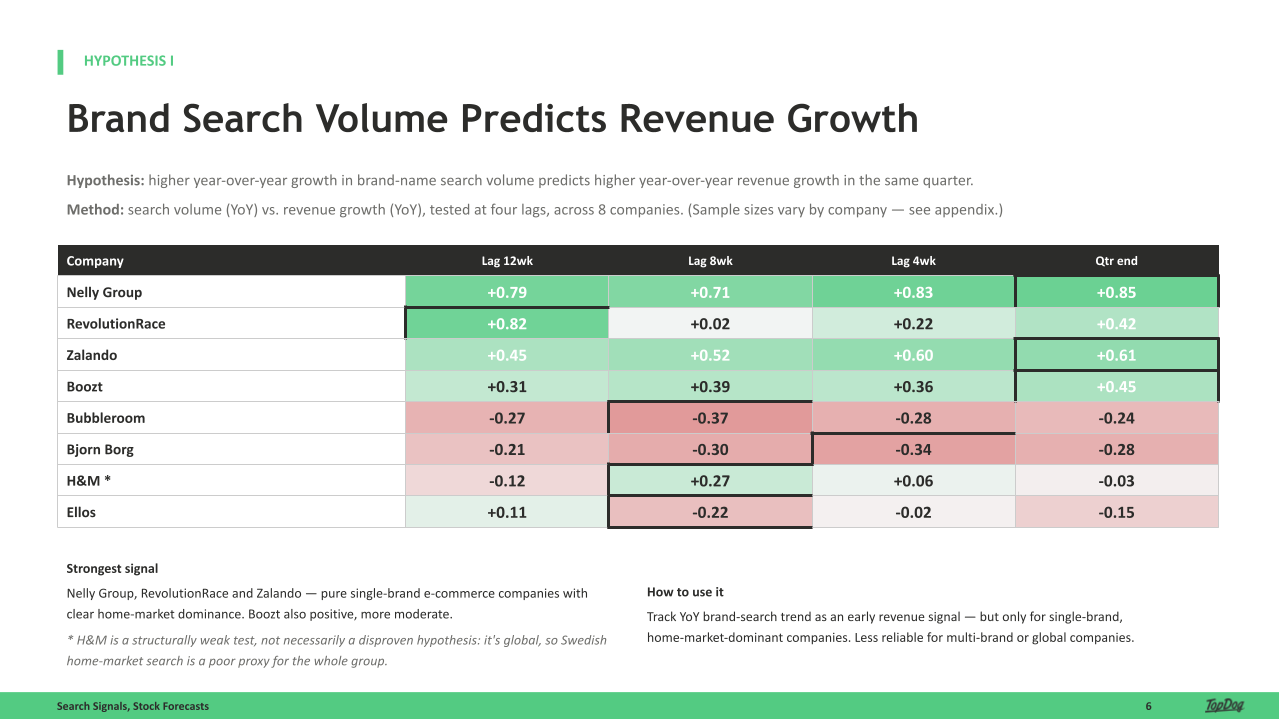
Nelly Group (+0.85), RevolutionRace (+0.82) and Zalando (+0.61) score highly, with Boozt somewhat lower but positive throughout. H&M is a weak test rather than a counterexample: the company operates globally, so Swedish search data says little about the group as a whole.
There are three reasons this data adds something to an analysis model:
- It arrives before the results. Quarterly reports come out four times a year. You can pull search data every month, in the middle of the quarter, while it’s still unfolding. That means you don’t have to wait for the results to adjust your view. You can adjust it continuously.
- It measures brand marketing that actually works. When a company runs good advertising, whether on TV, YouTube or through PR, it shows up as more people searching for its name. Marketing that hits the mark is enormously powerful, and search volume is one of the few metrics that captures that effect without the company having to report it itself.
- It measures loyal customers. People who search for the brand are often repeat visitors who simply like the retailer: the range, the site, the experience, the offers, the shipping. All of those things are hard to measure individually, but they show up in the fact that people keep coming back. Someone searching for the brand genuinely wants that specific retailer, and no other.
Put the three together and you have an indicator that’s both early and grounded in something real. That’s why it works.
Generic searches: valuable traffic, but not a forecasting signal
The second hypothesis was that SEO visibility would predict revenue growth. By visibility, we mean the share of a company’s keywords ranking in the top three for generic searches, things like “hiking trousers”, “skirts” or “tops”. Here, we couldn’t show any correlation.
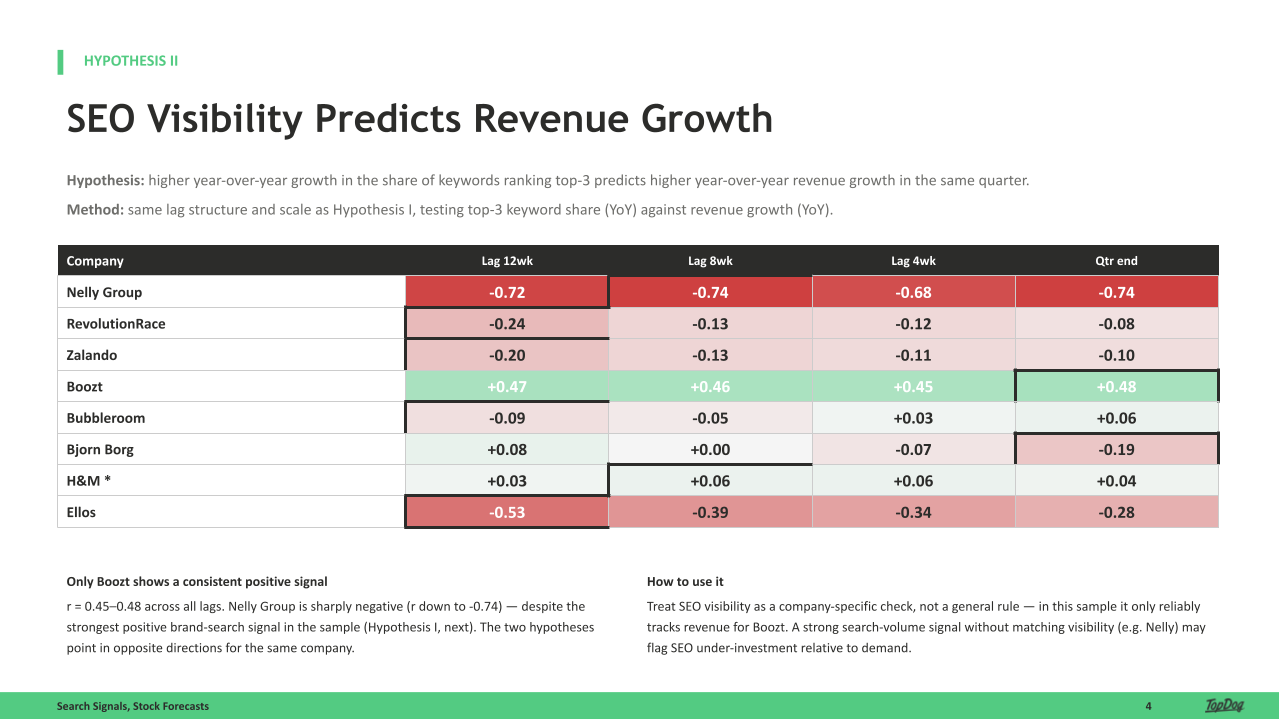
This chart follows the same structure as the one above, but here we’re testing the share of keywords in the top three instead of brand searches. The result is more or less the opposite. Only Boozt shows a stable positive correlation (+0.45 to +0.48 regardless of time window). Nelly Group comes out strongly negative (as low as -0.74), despite having the strongest brand signal of all.
So the two tests point in different directions for the same company, and that’s interesting in itself. Strong demand for the brand without matching visibility can be a sign that a company is underinvesting in SEO relative to the demand that already exists.
The absence of a correlation doesn’t mean organic traffic lacks value. It means it’s hard to tie to a single quarter.
Generic search traffic typically converts at 1 to 3 percent. That’s low, and it’s entirely natural: the user is in discovery mode. She compares options, reads up, maybe adds something to the basket, and buys three weeks later, through a different channel, after seeing an ad or getting an email. The value is real, but it’s spread out over time, and it often lands in a different quarter to the one where the search happened.
When so much of the traffic doesn’t convert on the spot, the link to any single quarterly report simply becomes too weak to be useful in a model.
The takeaway isn’t that SEO doesn’t matter. It’s that you should treat SEO visibility as a company-specific check rather than a general rule. For companies that genuinely get search engine optimization to work, it’s enormously valuable.
The model behind the analysis: four channels
To understand why the two hypotheses produce such different results, it helps to look at how a pure-play e-commerce business actually reaches its customers. I use a deliberately simplified model with four channels. It’s my own framework, not an industry standard, but it’s simple enough to put to use right away.
- Brand: The most important channel of all. It’s about demand for the product and everything that brings people back: TV and YouTube, PR, CRM and email, but also a site that’s easy to shop on. A good experience costs little cognitive effort, which is why visitors return. This is the channel that brand searches measure.
- Google Ads: The second most important channel for a pure-play e-commerce business. This is where you capture the small percentage of searches with the highest purchase intent, through Google Shopping, standard text ads and retargeting. Ads are also taking up more and more space on Google’s results page, in an ever-growing range of formats.
- SEO: I put search engine optimization in third place, not because it’s unimportant but because it’s difficult. It requires technology, content, user experience and external links to work together, and many companies never quite pull it off. The ones that do, however, get something enormously valuable.
- AI search: The newest channel, and the one we know least about. Visibility in ChatGPT, Google and other AI tools is barely measurable today, because these tools release very little data. We estimate that the split of high-intent purchase searches currently sits at around 80 percent conventional search to 20 percent AI search, though that figure is shifting fast. This is also why AI search isn’t included in the analysis: there simply isn’t enough data to compare it against.
For a stock analyst, the point is that these four channels sit at very different distances from the checkout. Brand and Google Ads are close to the point of purchase, SEO is further away, and with AI search, we simply don’t know yet. That distance is exactly what the two tests reveal.
How I’d put this to use
Add year-on-year growth in brand searches as a variable in your model for pure-play e-commerce companies, and pull the data monthly instead of waiting for the results. The signal is strongest for single-brand companies with a clear home market, and weaker for global groups and multi-brand companies.
Treat SEO visibility as a separate, company-by-company check rather than a variable in the model, and keep an eye on AI search. There isn’t enough data today, but there will be.


Christian Rudolf
VD och Sökmotorkonsult
Christian has +20 years of experience in SEO and digital marketing. His experience includes challenging sectors such as casino and finance, as well as global markets. What sets Christian apart in SEO is his focus on execution. This is the real challenge in SEO.

 +46 708 140833


